| Reference ranges |
|
Reference ranges vary considerably from one laboratory to another, and are dependent on the methodology and instrumentation utilized. This is especially true for serum enzymes, where methods may vary in pH, temper-ature, specific cofactors and substrate used in reaction. As a consequence, published "normal" values may not be valid for results generated by your lab. Reference ranges should be established by each laboratory, as they are instrumentation and reagent dependent. You should not compare one laboratory's results to another laboratory's reference intervals. Small deviations outside the reference interval may not be significant. In other words, clinically healthy animals may have mildly reduced or increased analyte values compared to a reference interval, but the values are actually normal for that animal. This is somewhat dependent on the analyte, e.g. mild elevations in liver enzymes are probably not significant (depending on clinical signs) in many animals, however electrolytes are maintained within fairly narrow limits and elevations in these are more likely to be clinically significant. Reference ranges are usually determined from a population of healthy adult animals. There are 2 general methods for determining reference ranges, based on the distribution of the data from these healthy animals. The resulting range then will include 95% of normal samples, regardless of the method. As a result, up to 5% of normal animals may fall slightly outside the reference range for a given test. When numerous tests are run on the same animal, the chances of obtaining one or more slightly "abnormal" results on an animal that actually is normal rises (p = 1 - 0.95n). For 12 tests, p = 0.46; for 21 tests, p = 0.66.
|
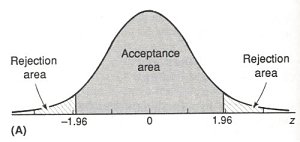 This is when the data is normally distributed, i.e. distributed symmetrically around the mean as illustrated to the right. The reference range is calculated as the mean ± 2 S, which encompasses 95% of the observations in healthy animals. The top 2.5% and bottom 2.5% results from healthy animals will fall outside an established range.
|
|
| back |