Hemoglobin concentration (Hb) is reported as grams of hemoglobin per
deciliter of blood (g/dL). Since red cells are approximately 33% hemoglobin,
the hemoglobin concentration of whole blood normally is about one third of the HCT

|
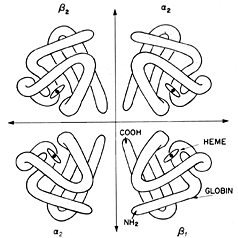
The Hb molecule is a tetramer composed of 2 alpha and 2 beta chains.
|
(i.e., the MCHC is 33%).
Traditionally, hemoglobin is measured using the cyanmethemoglobin
method. To measure the hemoglobin concentration, a lysing agent is added
to a sample of diluted blood; the lysing agent disrupts all the red
cells in the sample and releases the hemoglobin into the fluid so that
the sample then consists of a solution of hemoglobin. The hemoglobin
is converted to a form called cyanomethemoglobin and the concentration
is read by a spectrophotometer with the wavelength set at the peak absorbance
of cyanomethemoglobin. The concentration of hemoglobin is then calculated
from the optical density of the solution. Conditions which cause turbidity
in the lysate used in this assay, such as lipemia, Heinz bodies, or
red cell nuclei (avian, reptilian blood) can result in falsely high
absorbance and hence, overestimation of the [Hb]. Remember that hemoglobin-based
oxygen carriers, like Oxyglobin, are red and are measured as hemoglobin
with the cyanmethemoglobin method. This will always result in a high
Hgb (compared to the HCT).
The Advia also measures the hemoglobin content within the cell directly,
based on the complexity of the cell (which alters light scattering).
This value can be more accurate than traditional methods of measuring
hemoglobin, especially in conditions that artifactively increase hemoglobin
 concentrations,
including oxyglobin (see above). The Advia demonstrates this hemoglobin
concentration graphically in a histogram (see image on right). The histogram
represents the distribution of red blood cells by cellular hemoglobin
concentration (ranging from 0 to 50 g/dL). It demonstrates small populations
of cells with high (hyperchromic) or low hemoglobin (hypochromic) content,
even before there are changes in the mean hemoglobin concentration.
For example, in early iron deficiency, a second population of red cells
with low hemoglobin (hypochromic) may be seen to the right of the general
population of red cells that contain normal amounts of hemoglobin (normochromic)
before any changes in mean hemoglobin concentration are evident (see
below). concentrations,
including oxyglobin (see above). The Advia demonstrates this hemoglobin
concentration graphically in a histogram (see image on right). The histogram
represents the distribution of red blood cells by cellular hemoglobin
concentration (ranging from 0 to 50 g/dL). It demonstrates small populations
of cells with high (hyperchromic) or low hemoglobin (hypochromic) content,
even before there are changes in the mean hemoglobin concentration.
For example, in early iron deficiency, a second population of red cells
with low hemoglobin (hypochromic) may be seen to the right of the general
population of red cells that contain normal amounts of hemoglobin (normochromic)
before any changes in mean hemoglobin concentration are evident (see
below).
|